Reporting
A number of different reports are available for your HoxtonAi solution.
People count and occupancy data can be downloaded directly as a CSV for your own use and analysis.
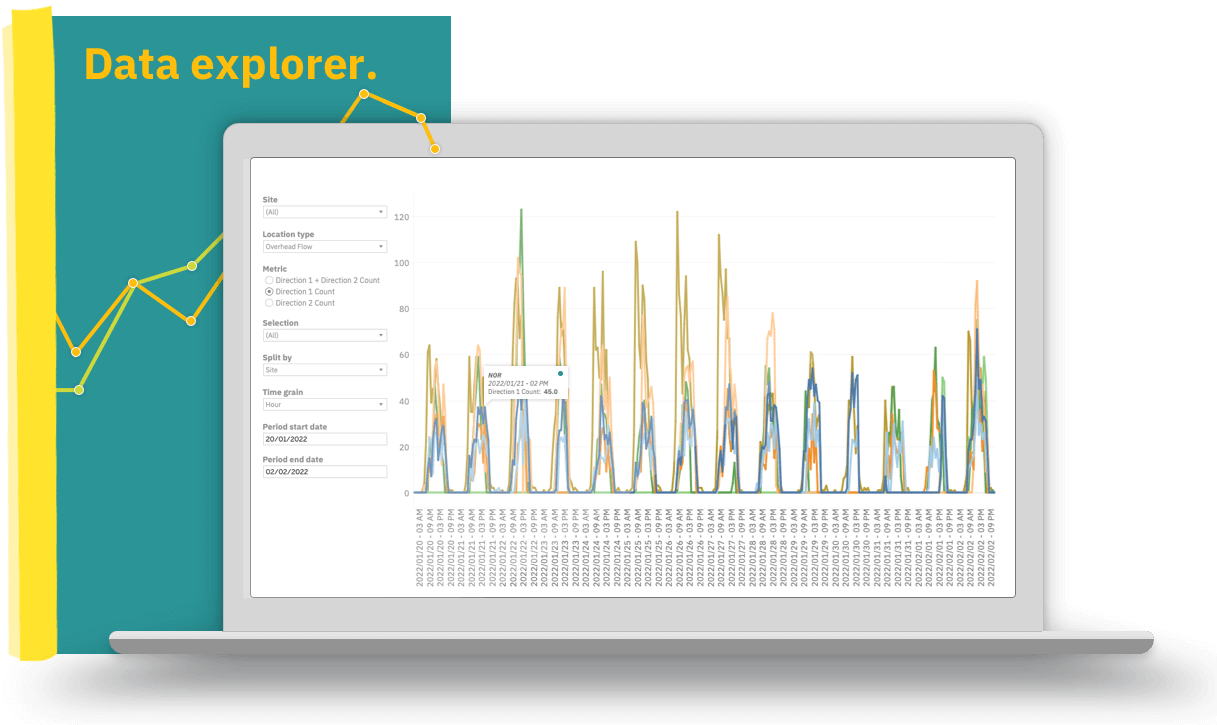
For even more detailed and customisable reporting, you can use the Data explorer. Data explorer provides you with advanced reporting metrics across four categories (depending on license).
People count CSV download
- Choose people count report downloads
- Select the start and end date of your reporting period
- Choose the granularity you want the report to use (eg: show people count data in 1 min/5 min/1 hr etc blocks)
- Select the cameras you want to include data from
- Click the download button at the bottom of the screen
If you have selected a large time period, there might be a short wait while the report is processed.
This short video will show the process of downloading your people count report.
Occupancy CSV download
- Choose occupancy report downloads
- Set the start and end date of your reporting period
- Select the metrics you want included in the report. Choose from: Avg. occupancy, Max. occupancy, Sum in, Sum out. (You can select as many metrics as you want, but be aware that selecting more metrics can take longer for the report to be created.)
- Choose the granularity you want the report to use (eg: show occupancy data in 15 min/30 min/1 hr etc blocks)
- Select the monitors you want to include data from
- Click the download button at the bottom of the screen
If you have selected a large time period, there might be a short wait while the report is processed.
This short video will show the process of downloading your occupancy data.
Data explorer
If you can't get the reporting you need from the report downloads, you can use our data explorer.
Data explorer provides you with advanced reporting metrics across four categories (depending on license).