Reporting

Time series
Compare multiple sites, spaces and doorways.
View your site traffic and space usage on a very granular level. Customers have found they can view trends, patterns and unusual behaviour in ways never before possible.
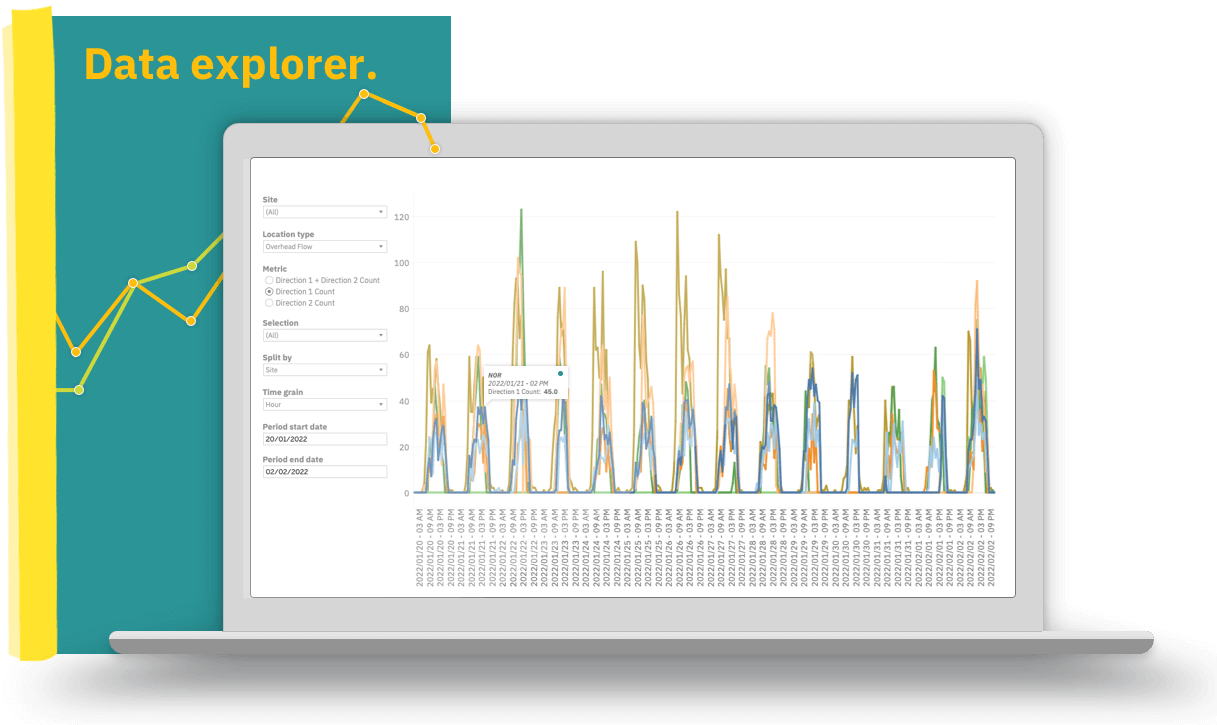
Seasonality tool
In addition to viewing details around traffic to sites, spaces and doorways - you can break this down to the time period of your choosing. Understand traffic behaviour on an hourly, daily, weekly, monthly or seasonal basis.

Time period comparison tool
Compare one time period with another. Giving you accurate traffic analysis to compare a target date range with any baseline time period of your choosing.

Real-time occupancy view
Our customers use the real-time occupancy of their sites in many different ways. We make it easy for everyone to view this data whether it's on a desktop in the office, an iPad at the reception desk or on the smartphone of a mobile building ops staff member.